70%
faster loads
1M+
events/day
<200ms
API p95
Web App2025·10 weeks·completed
Fintech Analytics Dashboard
Lead Frontend Engineer — Northbeam
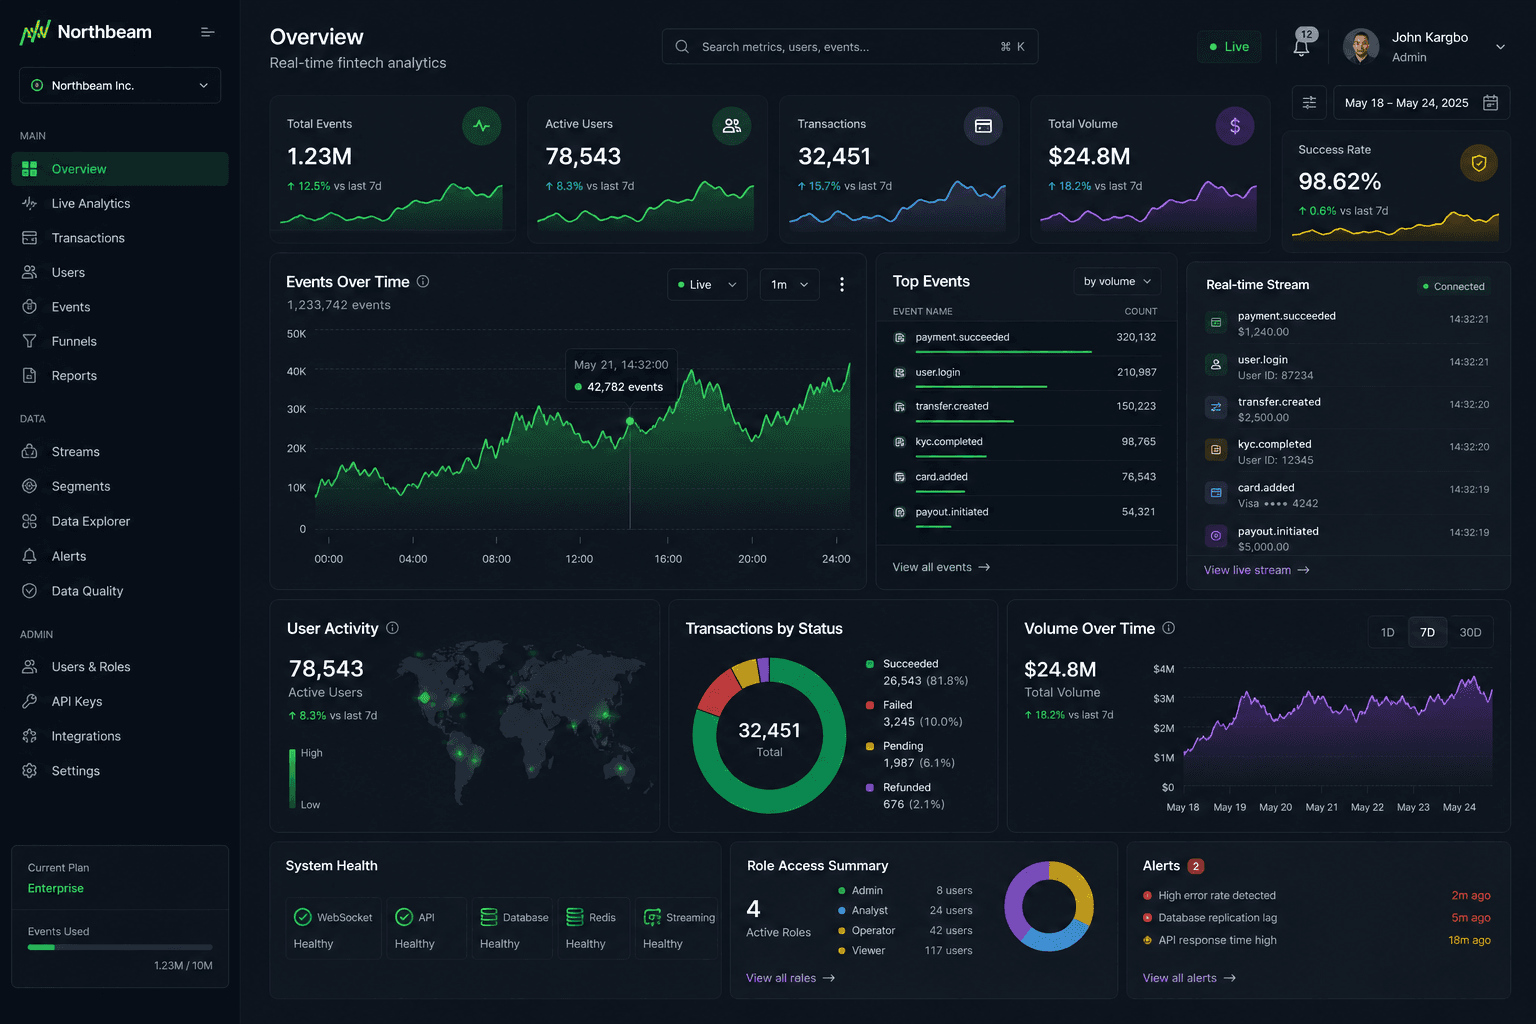
A realtime analytics dashboard for a fintech processing 1M+ events per day, with sub-second interactive charts and role-based access.
The Challenge
Rendering 50k+ live data points per view without dropping frames, while keeping the API under a 200ms p95.
The Solution
Virtualized canvas charts, windowed database queries, Redis-backed edge caching and optimistic UI updates.
Key Highlights
Sub-second interactive charts with 50k+ live data points
Role-based access with 4 permission tiers
Real-time event streaming via WebSocket
70% reduction in page load times
Code Highlights
Virtualized data
const visible = useMemo(
  () => rows.slice(start, end),
  [rows, start, end]
);
Memoizing the visible slice avoids re-computing on every scroll frame.
Edge cache
export const config = { runtime: "edge" };
const data = await cache.getOrSet(key, fetchMetrics, 30);
Running on the edge with a short TTL cache keeps p95 low.
Optimistic update
mutate(next, { optimisticData: next,
  rollbackOnError: true });
Optimistic data updates the UI instantly and rolls back on failure.
Tech Stack
Next.jsTypeScriptPostgreSQLtRPCRedis